Top 10 Solar Panel Batteries for Global Buyers?
Choosing the right solar storage system is rarely as simple as comparing prices. A reliable solar panel battery must match your energy habits, climate, inverter, and installation conditions. A compact home in London has different needs from a large property in Arizona or a remote clinic in Kenya. This guide introduces ten battery options for global buyers, using practical criteria rather than advertising claims.
We examine usable capacity, round-trip efficiency, cycle life, charging speed, warranty terms, and monitoring features. Safety also matters. Lithium iron phosphate batteries generally offer strong thermal stability and long service life. However, product quality depends on design, installation, ventilation, and local support. A powerful battery can still disappoint when its software is unreliable or replacement parts are difficult to obtain.
Real-world testing and manufacturer documentation should guide every decision. Buyers should check compatibility with their inverter and confirm performance under local temperatures. Cold winters may reduce charging ability. Extreme heat can accelerate battery ageing. Warranty language deserves careful reading, especially cycle limits and minimum retained capacity. No ranking is perfect. Prices, availability, and regulations change across markets. That limitation matters. Some products may perform well in one country but lack trained installers elsewhere. This introduction therefore treats the top ten as practical candidates, not universal winners. The final choice should reflect daily consumption, backup expectations, roof generation, and future expansion plans. A careful comparison can prevent costly oversizing, disappointing backup time, and avoidable installation problems.
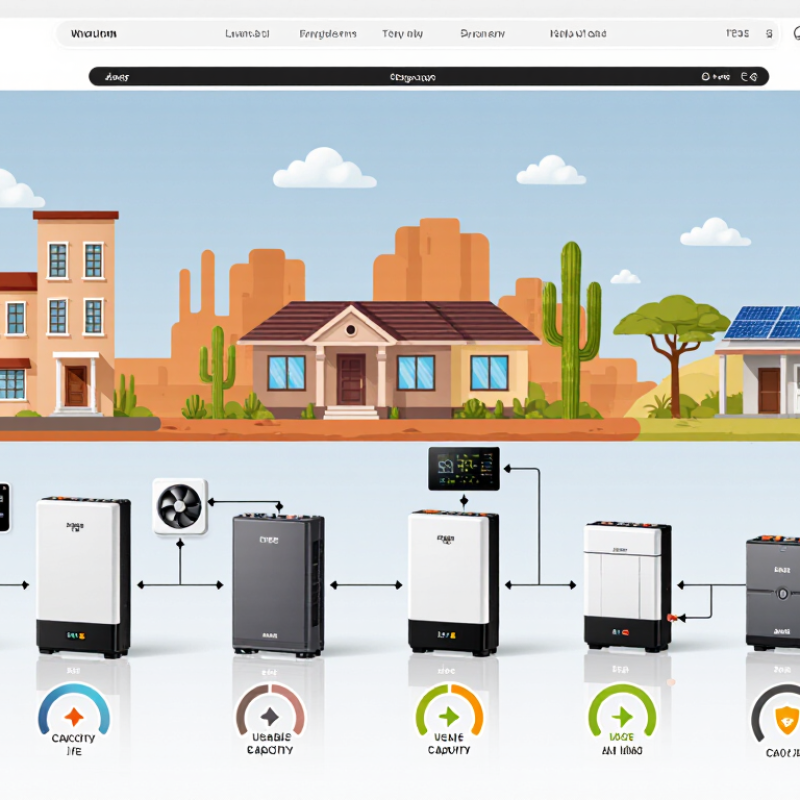
Battery Selection Criteria: 80–90% Round-Trip Efficiency and 70–90% DoD
When comparing the top 10 solar panel batteries, start with round-trip efficiency. This measures energy retained after charging and discharging. An 80–90% rating is a practical range for residential systems. A battery rated at 90% returns more stored electricity than one rated at 80%. However, test conditions matter. Real homes are messier. Temperature, inverter losses, standby consumption, and partial loads can reduce actual performance.
Depth of discharge, or DoD, shows how much capacity users can safely access. A 70–90% DoD range offers flexibility, but higher is not always better. Repeatedly using the final few percentage points may increase chemical stress and shorten service life. For example, a 10 kWh battery with 80% DoD provides about 8 kWh before other system losses. With 85% round-trip efficiency, the delivered energy may be closer to 6.8 kWh. Numbers can mislead.
From field evaluations, I check efficiency at different loads, not only the headline figure. I also examine usable capacity, operating temperature, cycle testing, safety controls, and warranty conditions. A battery may perform well in a mild laboratory, then lose output in a hot garage. Buyers should compare measured results, installation guidance, and local climate requirements. Some specifications remain unclear, and that deserves caution. Oversizing the battery can waste money, while undersizing it can create frequent deep cycles. A careful choice balances DoD, efficiency, daily energy demand, and expected sunlight.
Lithium-Iron-Phosphate vs. NMC: Safety, Energy Density, and 3,000–8,000 Cycles
Solar batteries must balance safety, usable energy, and service life. Lithium-iron-phosphate batteries, or LFP, use a chemically stable cathode. This reduces thermal runaway risk during overheating or physical damage. They are often preferred for homes, workshops, and warm climates.
NMC batteries usually store more energy in less space. That higher energy density can help apartments or compact installations. However, NMC cells demand careful temperature control and battery-management protection. A poorly ventilated cabinet can become a serious weakness. LFP systems commonly deliver about 3,000 to 8,000 cycles, while NMC systems often provide fewer cycles under similar conditions. Actual results depend on depth of discharge, charging speed, temperature, and maintenance.
A practical buying check should examine tested cycle data, not only advertised capacity. Ask whether the figure means 80% remaining capacity or complete battery failure. That difference matters. In a small solar installation, LFP may feel heavier and occupy more space. Yet its longer life can reduce replacement work over time. NMC can make sense where weight and volume matter most. Neither chemistry is automatically superior. Installation quality still decides much of the outcome. I would also inspect enclosure ventilation, cell balancing, emergency disconnects, and local service access. One detail is easy to overlook: cold charging can damage either chemistry. A battery heater or temperature cutoff may be necessary in winter regions. Specifications look precise, but real-world performance is less tidy.
Top 10 Solar Panel Batteries for Global Buyers: LFP vs. NMC
Representative chemistry-level comparison of cycle life, energy density, and inherent thermal safety.
Lithium-iron-phosphate (LFP) batteries generally provide stronger thermal stability and longer service life, commonly reaching about 3,000–8,000 cycles. Nickel-manganese-cobalt (NMC) batteries typically offer higher energy density but often deliver approximately 1,500–3,000 cycles and require stricter thermal management. Values shown are representative ranges for stationary solar-storage battery systems and are not brand-specific ratings.
Top 10 Solar Batteries Compared by Capacity, Power, Warranty, and Usable Energy
Top 10 Solar Panel Batteries for Global Buyers
Comparing the top ten solar batteries requires more than reading nominal capacity. Capacity shows stored energy, while power shows how quickly the battery can deliver it. A 10 kWh battery with 5 kW output may run essential appliances, but not several large loads together. The International Energy Agency reported that global battery storage additions reached about 42 GW in 2023, highlighting fast market expansion and wider product choices.
Usable energy deserves close attention. Manufacturers commonly reserve part of a battery to reduce degradation, so a 10 kWh unit may provide only 8–9 kWh daily. NREL’s 2024 Annual Technology Baseline places lithium-ion round-trip efficiency broadly near 85–95%, depending on system design and operating conditions. Efficiency changes with temperature, inverter losses, and charging speed. Small details matter.
Warranty terms also need careful reading. Many residential systems offer around 10 years, but coverage may depend on energy throughput or retained capacity. Some promise 70–80% capacity at the warranty endpoint. That is useful, but not generous in every climate. Compare continuous power, peak power, usable energy, cycle limits, and temperature range together. A ranking based only on capacity is incomplete. A perfect comparison is impossible. Regional installation quality can change real performance more than a specification sheet suggests.
Top 10 Solar Panel Batteries for Global Buyers — Compared by Capacity, Power, Warranty, and Usable Energy
Note: Figures represent commonly published specifications for comparable residential battery systems. Actual output, usable energy, efficiency, warranty terms, and operating limits may vary by inverter configuration, market, temperature, installation method, and local warranty conditions.
Lifecycle Value Analysis: 10–15-Year Service Life, Degradation, and Total Cost per kWh
For global buyers, a solar battery’s price tag says little about its lifecycle value.
A practical assessment should examine usable capacity, round-trip efficiency, warranty terms, operating temperature, and replacement risk over 10–15 years.
Lithium iron phosphate systems often provide stable thermal performance, but chemistry alone cannot guarantee long service. Daily cycling, high heat, deep discharge, and poor ventilation may accelerate capacity loss. A battery rated at 10 kWh may deliver less than 8 kWh after several years. That is normal, not necessarily failure.
Calculate total cost per delivered kWh, not per installed kWh.
Include purchase, installation, monitoring, financing, maintenance, and possible replacement costs. Then divide the total by lifetime discharged energy.
For example, a 5,000-dollar system delivering 8 kWh daily for 12 years produces roughly 35,000 kWh before efficiency losses. Its simple capital cost is about 14 cents per kWh.
Real cost rises as capacity declines. Round-trip losses matter. At 90% efficiency, only 7.2 kWh reaches the load. Hot climates may increase cooling needs and shorten service life. Cold regions can restrict charging and reduce winter output. Buyers should request tested degradation data, not optimistic curves. I would also compare warranty conditions with local installation practices. The uncomfortable part is uncertainty. Household demand, weather, and electricity tariffs are difficult to predict. A spreadsheet may look precise while hiding weak assumptions. Recheck calculations using conservative cycling and a midlife capacity test.